First Look from BenchSights
Surprise, Surprise… AEs Respond to Variable Comp!
Who knew? Salespeople respond to strong variable comp incentives… But by how much? New data from 50 BenchSights members provides real proof from your peers and insights into how well these plans actually work. Here’s the chart:
What Percentage of Quota Capacity Did Your AEs Achieve?
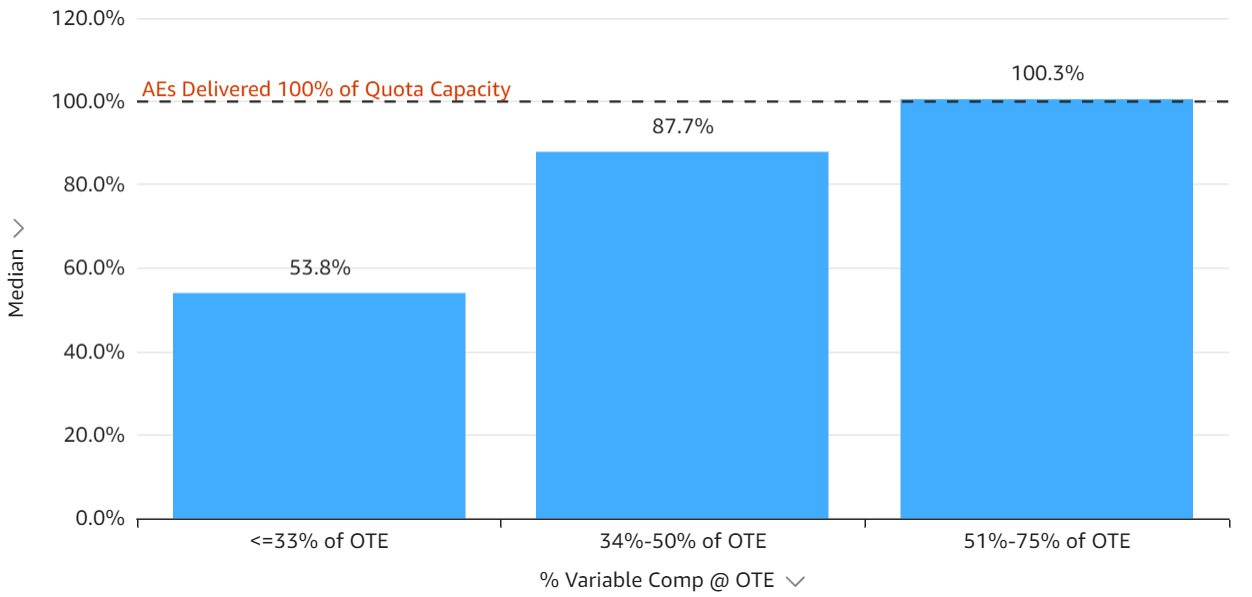
- AE teams with 50% or more of their compensation paid through variable comp @ on-target-earnings, delivered 100% of their Quota Capacity (QC)
- AEs with comp plans paying 33% or less variable comp delivered roughly half of QC
That’s a performance gap of 2x!
What does this mean for you? Anyone with an AE comp plan paying less than 50% variable comp, should take a serious look at making some changes.
Want more data like this? Join BenchSights. We’re building a “Data Co-op” for the software sales industry. Your data is always kept anonymous and confidential. Membership is free and all active members providing data gain access to our free BenchSights reporting. Click here to get started.
* On-target-earnings (OTE) is the amount AEs earn when they achieve quota
* Quota Capacity (QC) is the aggregate bookings that would be achieved by the sales team if all ramped AEs delivered quota
SaaS Companies With the Most Generous Payouts are the Best Performers
Earlier this month, in our initial post, we saw that software sales reps perform significantly better when their comp plans are more heavily weighted to variable comp.
In another “shocker”, today’s post shows that higher total payouts to AEs — as measured by the Quota-to-OTE Ratio* — are also correlated with better performance. Significantly so. Here’s the chart:
What Percentage of Quota Capacity Did Your AEs Achieve?
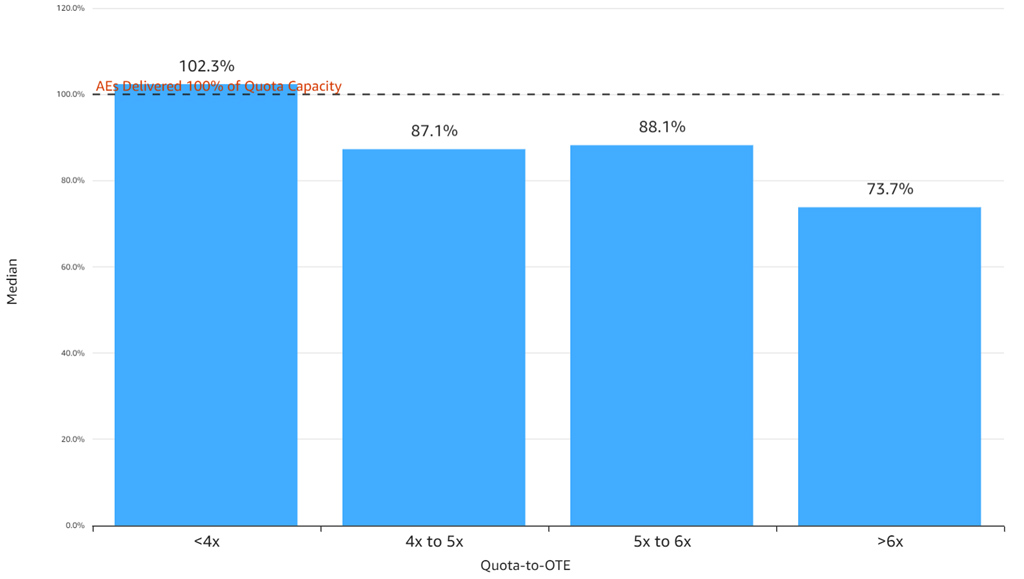
- Companies paying their AEs <4x Quota-to-OTE — the most generous bucket — delivered over 100% of their Quota Capacity* (QC)
- Companies with less generous pay packages delivered 15% to 30% points less QC
Wow! So maybe variable compensation doesn’t matter as much as we thought? Just pay them more overall! It’s a tempting conclusion. But reality is certainly more nuanced. Why? Correlation does not tell you “cause and effect”.
Consider this alternative explanation: Let’s assume that the strongest companies are determined to recruit the best AEs and do so, in part, by paying them more. It’s indisputable that strong companies can recruit better reps and pay them more. But these reps don’t perform better because they’re paid more. They were better to begin with!
No doubt, the answer we are looking for is: “it depends”. We’ll need to dig further and will do so as our membership grows and we collect more data. But the correlation cannot be ignored. As a final note, consider the fact that 42% of our users paid Quota-to-OTE below 4x. More than we would have suspected. So if you’re thinking it’s uncommon to pay this much, you’d be wrong.
Want more data like this? Join BenchSights. We’re building a “Data Co-op” for the software sales industry. Your data is always kept anonymous and confidential. Membership is free and all active members providing data gain access to our free BenchSights reporting. Go to https://benchsights.com to get started.
* Quota-to-OTE Ratio is: Quota (target ARR bookings for a rep in a fiscal year) divided by the compensation that rep would earn if they deliver quota precisely (base salary plus variable comp @ OTE)
* Quota Capacity (QC) is the aggregate dollar bookings that would be achieved by the AEs if all ramped AEs delivered quota exactly in the fiscal year
AEs Perform Better When You Use Accelerators
In our previous posts, we showed that software salespeople perform better when they’re paid more – especially when the comp plan is weighted more heavily to variable compensation.
How about the use of Accelerators? How well do they work and how aggressive should you be? BenchSights provides some insights. Here’s the chart:
Median % of Quota Capacity Achieved
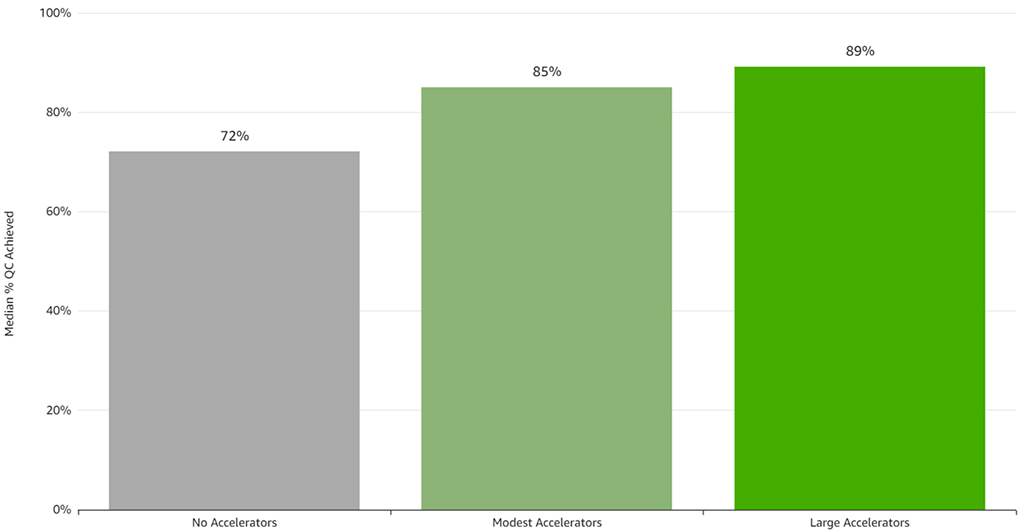
*We define Modest Accelerators as a 10-20% bump in commission rates for performance over quota (e.g., from 10% to 11-12%); Large Accelerators bump commission rates by >20%.
Our data reveals that those who use Accelerators had much better median performance:
- AE Teams with No Accelerators achieved 72% of Quota Capacity*
- AE Teams with Modest to Large Accelerators achieved 85-89% of QC
Accelerators clearly work. But, an equally valuable insight: You don’t need to overdo it. A “modest” bump of 10-20% in commission rates may be all that’s required
Want more data like this? Join BenchSights. We’re building a “Data Co-op” for the software sales industry. Your data is always kept anonymous and confidential. Membership is free and all active members providing data gain access to our free BenchSights reporting. Go to https://benchsights.com to get started.
* Data measured across 43 sales teams, of which 37% used Large Accelerators, 35% Modest Accelerators, and 28% No Accelerators. QC is total ARR bookings achieved by the AE team divided by the product of (1) avg. Quota per AE and (2) avg. number of AEs
In Software Sales Comp, Carrots Are More Effective Than Sticks
Carrots or sticks? Which work better for software sales incentive compensation? In our previous posts, we showed that “carrots”, in the form of lower quota-to-OTE ratios*, higher variable compensation, and accelerators – are extremely effective. What about “sticks” – decelerators which pay lower commission rates when reps perform below quota? Here’s a chart comparing performance between companies which use them and those that don’t:
Median % of Quota Capacity Achieved
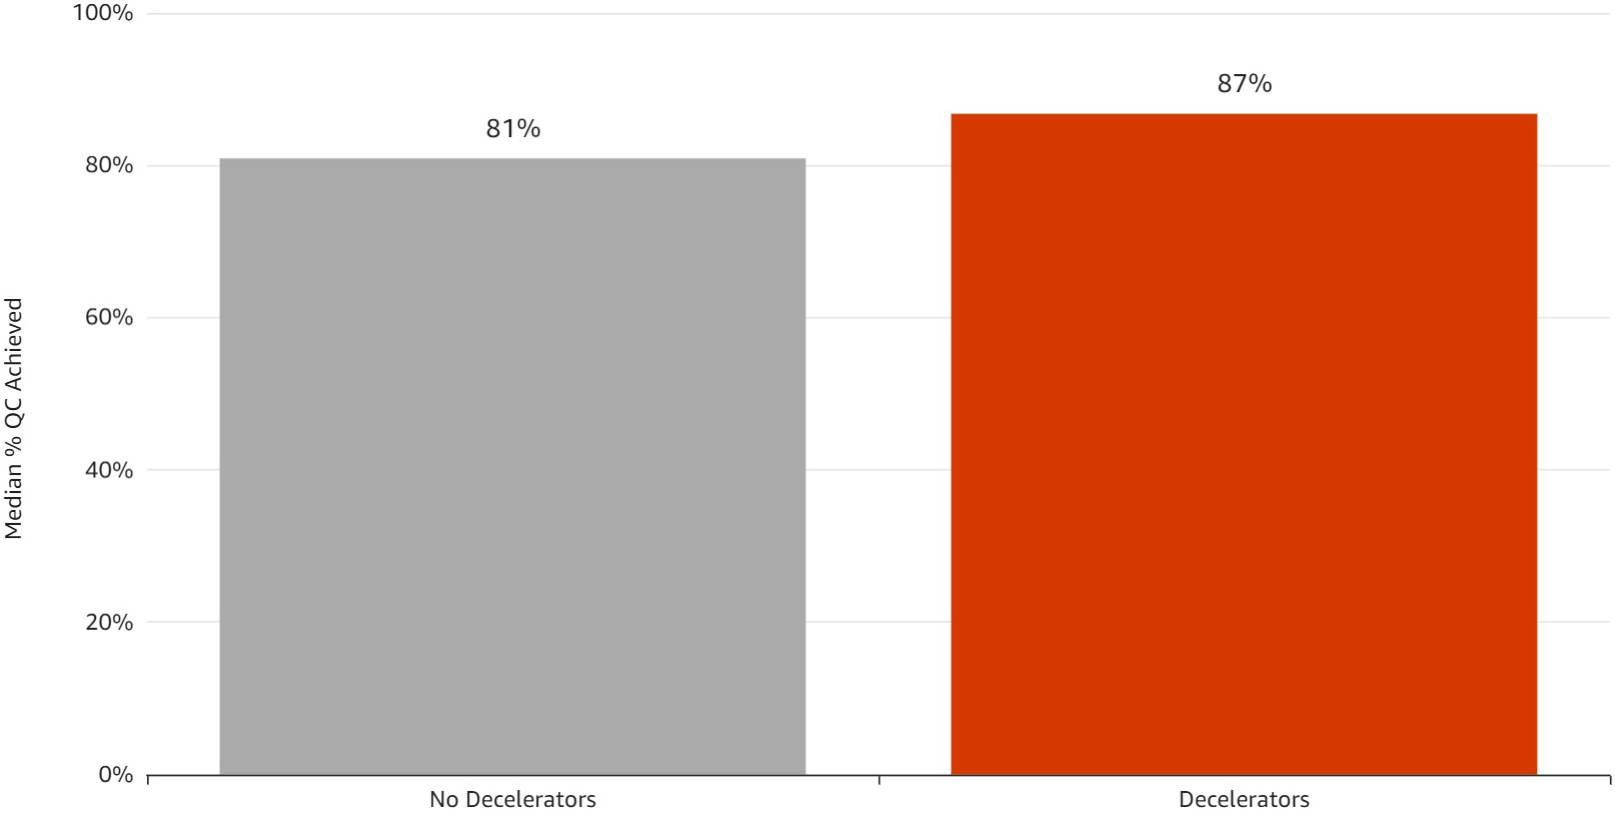
- AE Teams with no decelerators achieved a median 81% of Quota Capacity*
- AE Teams using decelerators achieved 87% of QC
So decelerators do seem to help, though only a little. Another argument for decelerators: companies using them had a lower percentage of reps who missed quota badly (20%), vs. those who didn’t use them (25%).* Again, decelerators helped, but only a little. Bottom line, we think the jury’s still out on decelerators. Either way, it’s clear that “carrots” work much better than “sticks” when it comes to software sales comp. What do you think?
Want more data like this? Join BenchSights. We’re building a “Data Co-op” for the software sales industry. Your data is always kept anonymous and confidential. Membership is free and all active members providing data gain access to our free BenchSights reporting. Go to https://benchsights.com to get started.
* Data measured across 24 sales teams who reported Decelerator data, of which approximately one-third used Decelerators. OTE is on-target earnings that an AE earns when delivering quota. QC is total ARR bookings achieved by the AE team divided by the product of (1) avg. Quota per AE and (2) avg. number of AEs. AE performance “well below quota” is defined as AE performance of <75% of Quota.
How Many of My Reps Need to Hit Quota?
How many of your reps should be hitting quota? It’s tempting to say “all of them!” But that’s not realistic. Not all AEs work out and quotas shouldn’t be a “gimme”. Using BenchSights data, we looked at AE performance tracked against overall group performance:
What % of AEs Performed below/Above Quota?
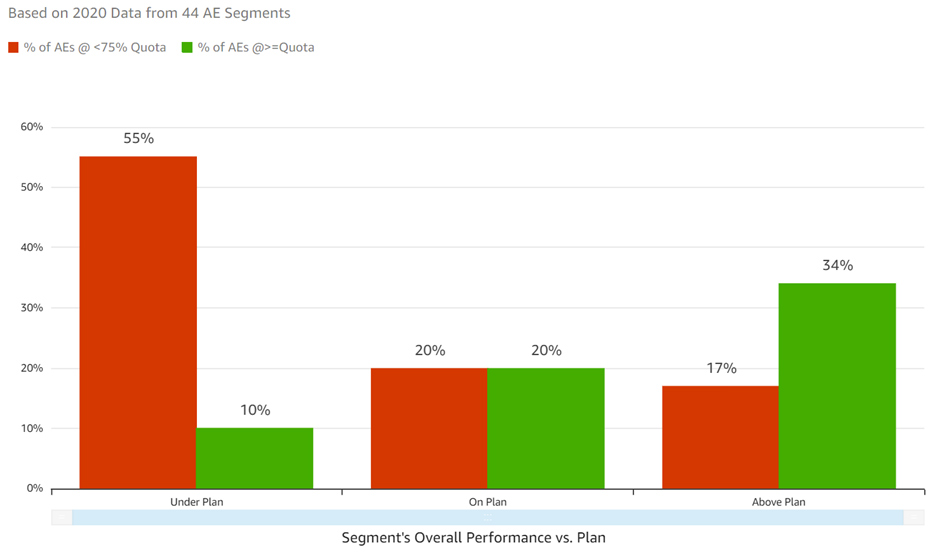
- AE segments which collectively performed “Under Plan” had a median of just 10% of their reps at/above quota, with 55% missing badly.
- AE segments performing “On Plan” or “Above Plan” had a median of 20%-34% of their reps at/above quota, and 17%-20% missing badly.
Of course, it’s no surprise that if 55% of your reps whiff, you’re going to miss your plan! The valuable insight here is that you can be comfortable with up to 20% of your reps missing badly. Just make sure that at least another 20% meet or beat quota, and give yourself some cushion. In our data, the “On Plan” segments delivered a median of 88% of Quota Capacity* – so 12 points of cushion.
Want more data like this? Join BenchSights. We’re building a “Data Co-op” for the software sales industry. Your data is always kept anonymous and confidential. Membership is free and all active members providing data gain access to our free BenchSights reporting. Go to https://benchsights.com to get started.
* AEs “missing badly” is defined as performance of <75% of quota. Quota Capacity is total ARR bookings achieved by the AE team divided by the product of (1) avg. Quota per AE and (2) avg. number of AEs.
A Look at AE Commissions
In software sales compensation, managers tend to focus on metrics like quota, on-target-earnings (OTE), and the Quota-to-OTE Ratio. For good reason – these metrics are fundamental drivers of your economics.
But you shouldn’t ignore commission rates, since they are where the action is for the AE. Once they’re on the job, the commission rate is the one metric that tells them how much more they’ll make when they close deals. So it’s critical to understand the market for commissions. Here’s what we find when looking at the data from BenchSights:
Distribution of AE Commission Rates at OTE
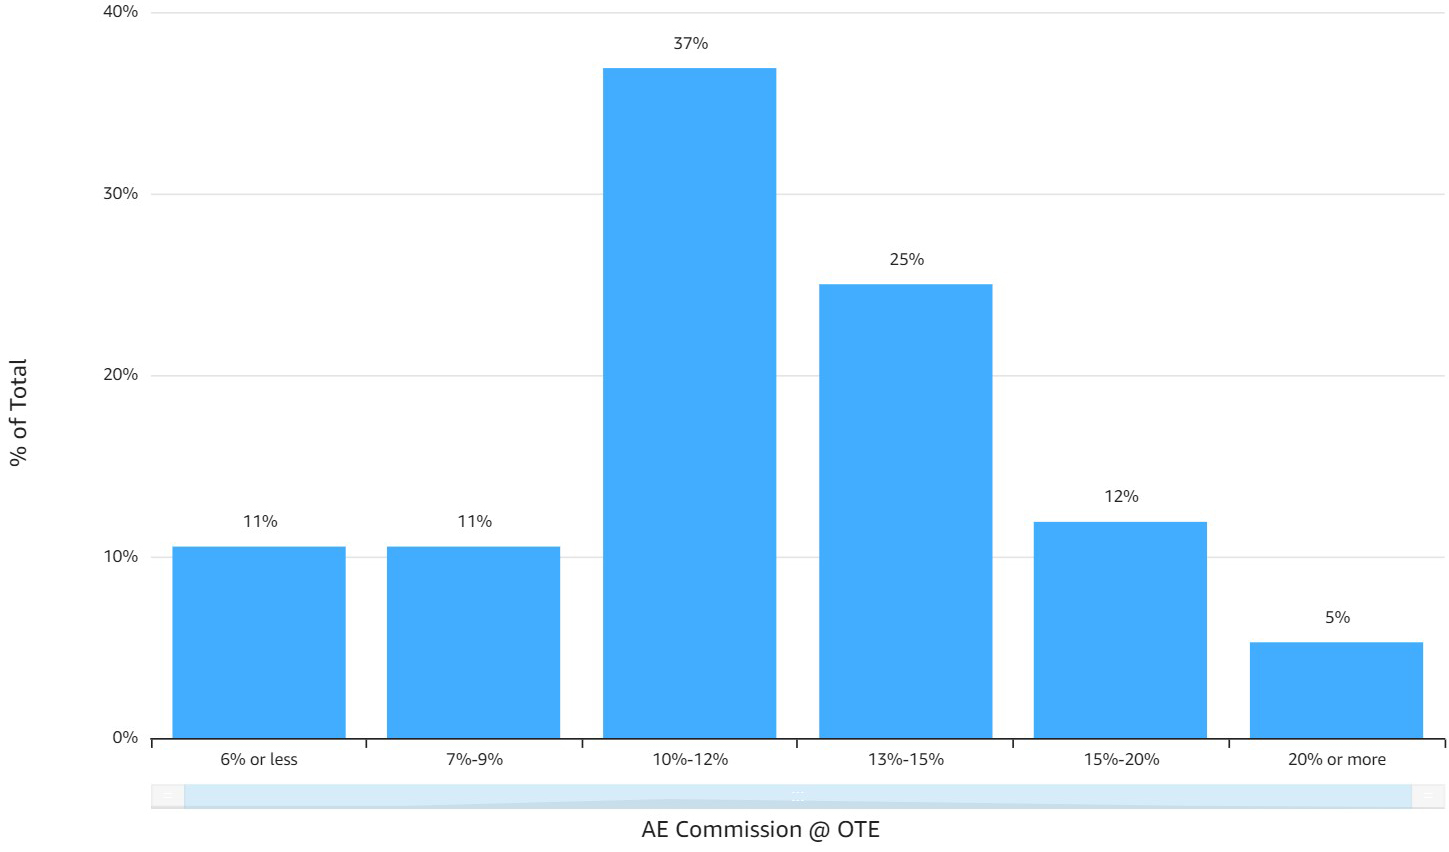
- Classic bell curve centered at 10%-12% (median=11.5%)
- Over 60% set commissions between 10% and 5%
How do decisions on commissions impact performance? The answer is they do, but it’s a bit nuanced. Specifically, we found that if you’re on the left side of the bell curve, your performance tends to deteriorate. For example, we found that AEs with commissions below 8% tended to deliver much poorer performance – a 20% point difference of achieved quota capacity. Interestingly, beyond the 8% threshold, we didn’t find significant correlation. In other words, statistically, companies weren’t better off playing 15% vs. 10%.
Of course, your situation may be different. Selling a lower margin product may dictate a need for lower commissions. The generalized lesson still holds though. Avoid being on the left side of the commission rate bell curve.
Want more data like this? Join BenchSights. We’re building a “Data Co-op” for the software sales industry. Your data is always kept anonymous and confidential. Membership is free and all active members providing data gain access to our free BenchSigh– Quota ts reporting. Go to https://benchsights.com to get started.
* The base commission rate is the variable compensation paid to an AE who delivers quota, divided by the quota (ARR basis)). Quota Capacity (QC) is total ARR bookings achieved by the AE team divided by the product of (1) avg. quota per AE and (2) avg. number of AEs.
Quota Against On-Target Earnings
It’s an age-old question: Where should you set Quota for AEs? The accompanying chart maps Quota against On-Target Earnings among 83 members of BenchSights. As a reminder, On-Target Earnings or OTE, is the compensation that a quota-carrying sales rep (AE) earns if they deliver Quota:
Distribution of AE Quota and OTE
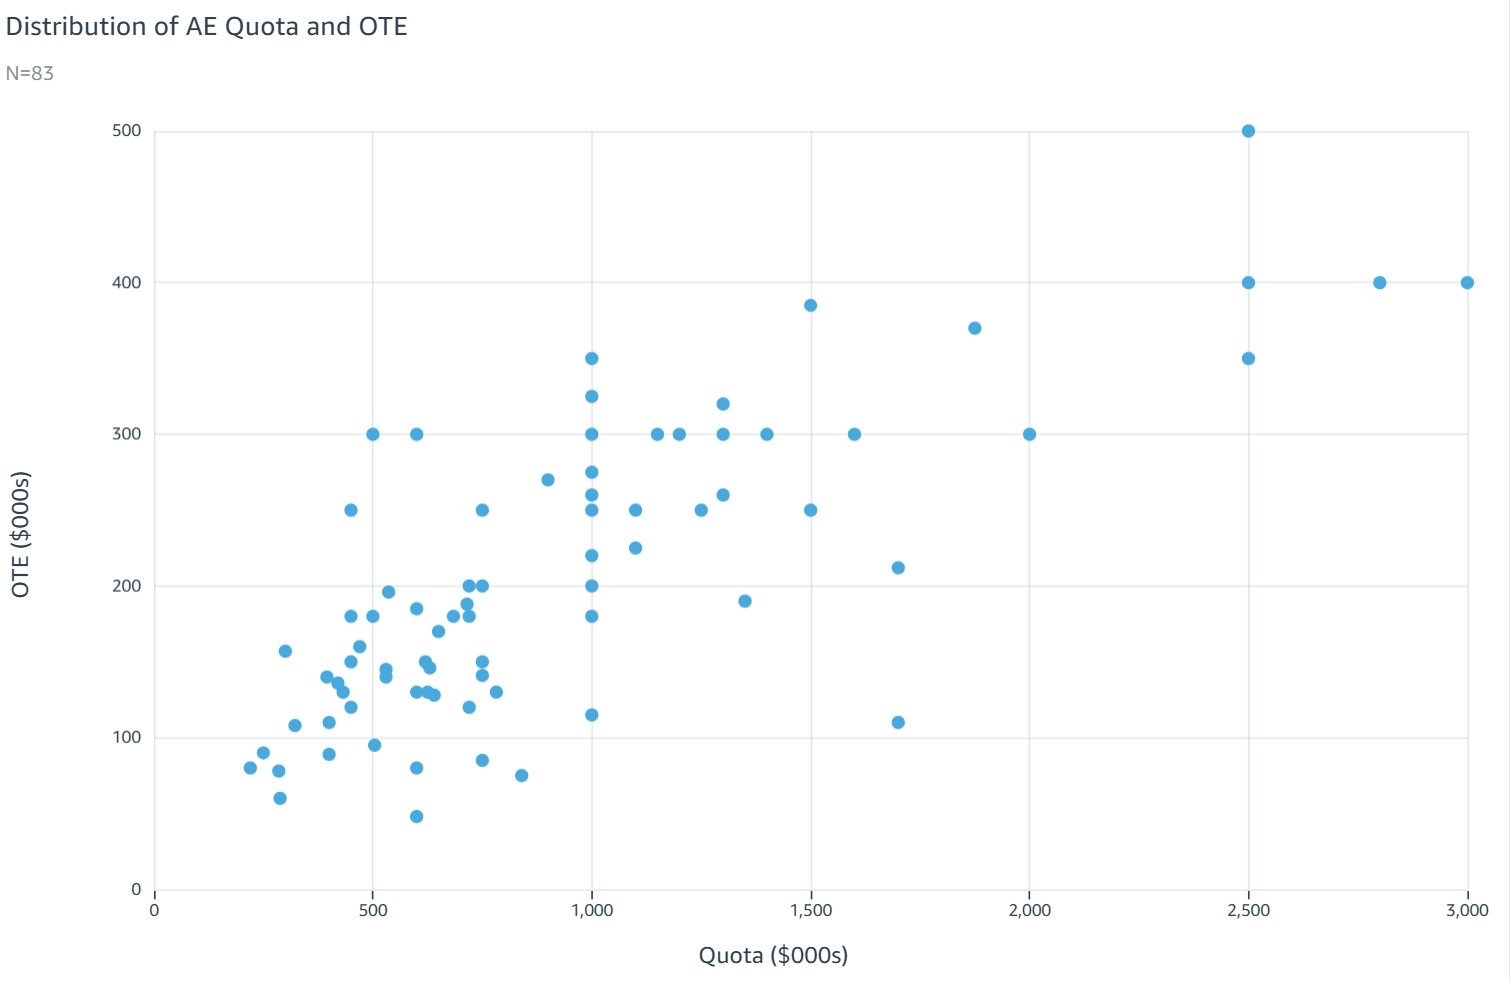
We found an average Quota of $955k in ARR bookings and a median of $750k.
The natural follow-on question is: So what?! Does it matter? Will different levels of Quota drive different levels of performance? The answer: Not really. At least not that’s evident from our data:
Company Sales Segments with an ARR Quota of:
| <$750k | $750k to $1.25M | >$1.25M | |
|---|---|---|---|
| Median % of Quota Capacity* Achieved | 87% | 66% | 82% |
| Median % of AEs “Hitting” Quota | 25% | 28% | 20% |
| % of Company Segments Meeting/Beating Plan | 50% | 42% | 46% |
Of course, there are many other factors at play. For example: Is it smart to have less than 30% of your reps meeting Quota? Probably not – but keep in mind that most of our data is from 2020, which had some “issues”. Also, direct comparisons of Quota across companies is difficult – a $1.5M Quota at one company may actually be easier to hit than a $750k Quota at another.
We believe the more useful metric is Quota-to-OTE. Look again at the accompanying chart. You can easily fill in the regression line with your own eyes – the slope of 4.8x is actually the mean Quota-to-OTE ratio across our membership.
And, as opposed to Quota by itself, we find the Quota-to-OTE ratio to be strongly correlated with performance. Segments with lower Quota-to-OTE ratios – higher pay for performance – tended to have stronger performance (see our previous post).
So feel free to gauge where to set your Quota by looking at your peers. But make sure to use the Quota-to-OTE ratio, and other variable comp strategies, as more effective drivers of performance.
Want more data like this? Join BenchSights. We’re building a “Data Co-op” for the software sales industry. Your data is always kept anonymous and confidential. Membership is free and all active members providing data gain access to our free reporting. Go to https://benchsights.com to get started.
* Quota Capacity (QC) is total ARR bookings achieved by the AE team divided by the product of (1) avg. quota per AE and (2) avg. number of AEs.